Research #2
EQT: Aligned Operator Focused On Integration
Pure Value Ideas · Oct 26, 2026
Summary
We wanted to research the US natural gas space, intrigued by its long-term demand prospects. LNG export plants are already financed and going up on the Gulf Coast, and data centers and retiring coal plants need more power. The question was which producer to own, and two things drew us to EQT. The first is cost. Over the twelve months to June it earned $2.52 of cash margin per Mcfe, the best in its peer group, on cash costs of $1.02. The second is Toby Rice. His family built Rice Energy and sold it to EQT in 2017. Two years later he won a proxy fight for the board and became CEO, and he's taken a $1 salary every year since. Under him EQT bought back its pipelines and went from burning cash to making it: $7.7bn of free cash flow since 2020, after burning $6.3bn over the 15 years before.
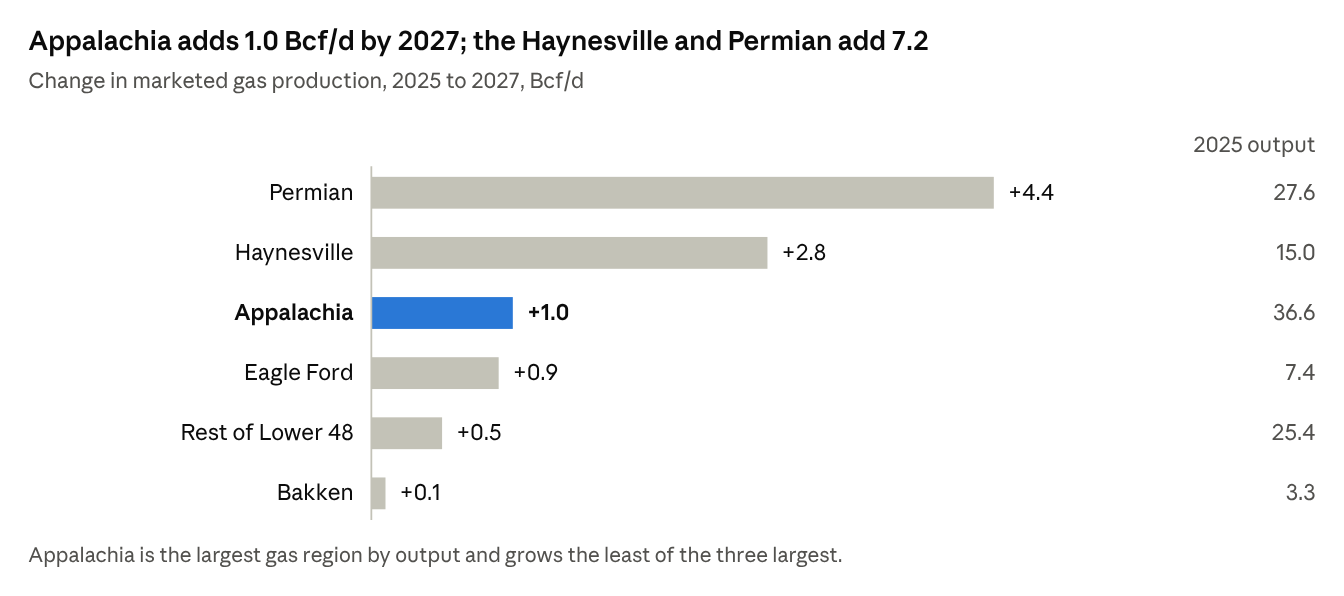
All of EQT's gas comes from Appalachia, which is growing far more slowly than the rest of the country. EIA's October outlook has the basin adding 1.0 Bcf/d by 2027, against 7.2 from the Haynesville and Permian. So EQT's job is to get its gas out. It holds firm pipeline capacity out of the basin, and it has contracts that sell at outside prices: LNG bought at Gulf Coast plants, and a supply deal priced off PJM power.
On 26 October EQT agreed to buy Range Resources. Once the deal closes it'll be the biggest gas producer in the US, guiding to about 9.0 Bcfe/d for 2026 against Expand Energy's 7.5, with 78% more proved reserves than Expand. It's also the only producer in the group that owns interstate pipelines as well as gathering.
Range makes EQT bigger and longer-lived, but a little less profitable per unit until the synergies come through. On our numbers the combined company ranks first in the group on production and reserves, and second on cash margin ($2.35/Mcfe) and leverage (0.79x at June).
We put it in the top tier, alongside Expand. Expand has two basins. EQT has its own pipelines and more contracted demand than anyone, and for a producer tied to one basin we think contracts that sell gas at outside prices are worth more than a second basin.
The industry: where the demand comes from
Two things drive the growth in US gas demand: LNG exports and power. EIA has both growing this year, LNG exports from 15.1 to 17.6 Bcf/d and power burn from 35.8 to 37.0. The catch for an Appalachian producer is location. LNG is on the Gulf Coast, where Haynesville and Permian gas fills it. Power is the one big growth market Appalachia can reach directly.
The demand stack
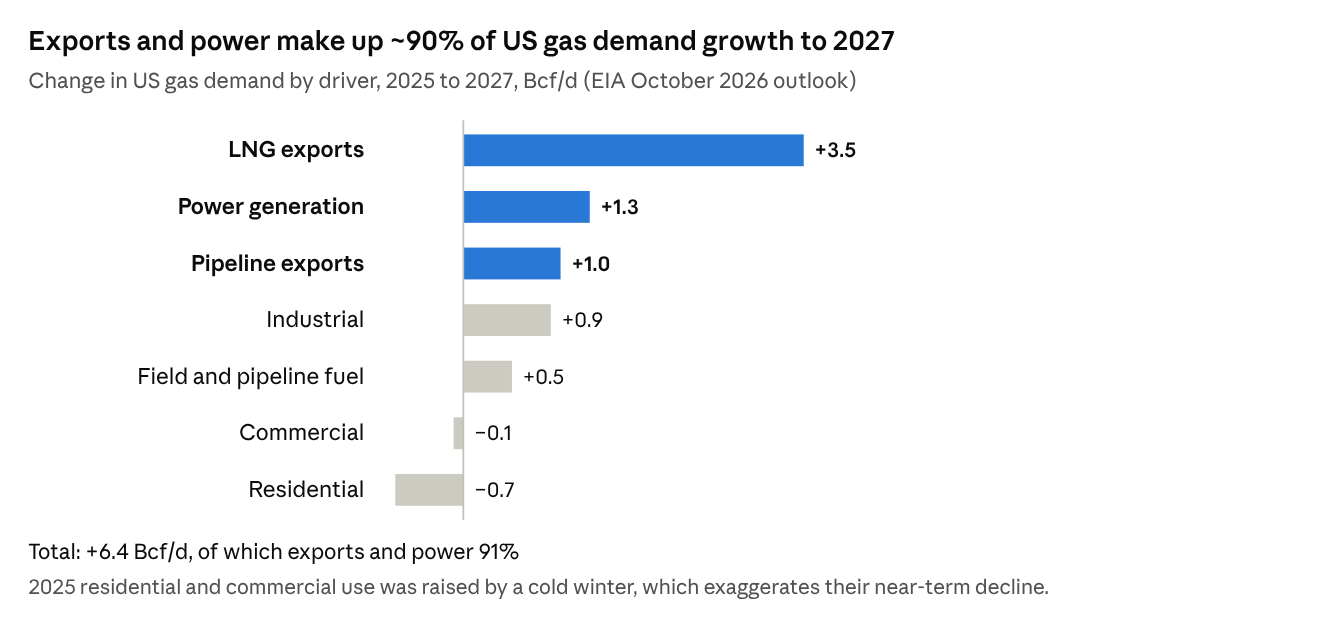
Exports and power make up about 90% of the 6.4 Bcf/d that EIA expects US demand to add between 2025 and 2027.
EIA Short-Term Energy Outlook, October 2026
- Everything else adds only about 0.6 Bcf/d. Industry and field fuel grow a little, while homes and businesses use slightly less.
- Pipeline exports add about 1 Bcf/d, almost all of it to Mexico through Texas. Canada sends the US more gas than it buys, so neither market helps Appalachia.
- For now supply is growing faster than demand. EIA has dry gas output up 4.2% this year and 3.5% next, against about 3.0% and 2.5% growth in demand plus exports. You can see it in storage, which EIA expects to end October about 2% above the five-year average, and in Henry Hub, which it has falling from $3.48/MMBtu this year to $3.16 in 2027.
- Producers are already holding gas back. EQT curtailed 21 Bcfe in the third quarter and plans 10–20 Bcfe more in the fourth, and Expand is cutting from about 12 rigs to 10. Expand's COO calls 2027 "one of transition" before about 13 Bcf/d of new demand arrives by the end of 2028.
- Further out, we're more bullish on power than EIA. Its long-range outlook gets LNG exports to about 27 Bcf/d by 2035 but has power burn falling, which we think undercounts data centers and coal retirements. EIA itself says that outlook shouldn't be read as the most likely outcome.
Exports: LNG
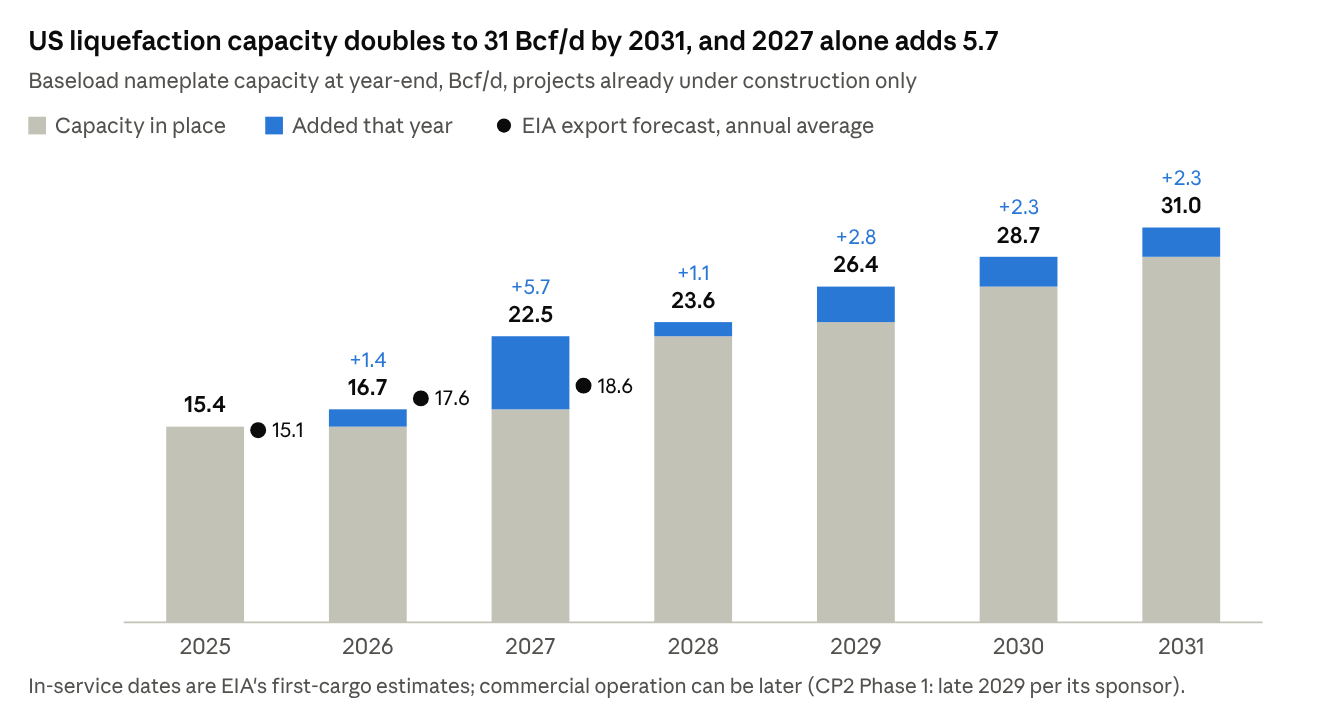
LNG is the most dependable source of growth, because the plants are already paid for. The US shipped 15.1 Bcf/d in 2025, about a quarter of world LNG trade, and 17.4 Bcf/d over January to July this year. DOE counts more than 20 Bcf/d of capacity operating and 17.7 Bcf/d under construction. Its figures are authorized volumes, which run above the nameplate capacity in the chart.
EIA's U.S. Liquefaction Capacity workbook (1 Oct 2026), by EIA in-service year; exports from EIA STEO October 2026
- Plants are running above nameplate this year, which is why exports sit above capacity in the chart. That flips in 2027. EIA has exports at 18.6 Bcf/d against 22.5 Bcf/d of year-end capacity, because most of the new trains start late in the year and take months to ramp up.
- Start dates can slip. EIA has CP2's first phase shipping LNG in the second half of 2027, but Venture Global's own filing puts commercial operation in late 2029, so read the chart's dates as the early case.
- The sanctioned build ends in 2031. Approved projects still waiting on a final decision would add about 6.2 Bcf/d more.
Exports: Europe's shortfall
Europe is US LNG's biggest market. The EU imported 131 bcm of LNG in 2025, and the US supplied 58% of it, about 7.4 Bcf/d or half of everything the US shipped. In the second quarter of 2026 the US share reached 63%.
- The shortfall comes from supply. EU consumption was 340 bcm in 2025, about 16% below its 2017–21 average, and the IEA expects it to fall again this year.
- Russia is being written out by law. EU rules ended short-term Russian contracts in April and June this year, and end long-term LNG contracts on 1 January 2027 and pipeline contracts by late 2027. Russia still supplied about 36 bcm in 2025, so roughly 3.5 Bcf/d has to be replaced by the end of next year.
- Qatar has mostly dropped out. EU imports from Qatar were 2.0 bcm over January to August, down from 6.5 bcm a year earlier. Two damaged Qatari trains need three to five years of repairs, and September's shipments through Hormuz were about a fifth of the pre-war rate (Kpler data reported by MEES).
- EU production covers only about a tenth of demand, and Norway, its biggest pipeline supplier, expects output to start declining around 2030.
- Storage is low going into winter: 74.9% full on 26 October, with Germany at 61.6%.
- Europe's TTF benchmark averaged $21.53/MMBtu in the third quarter against $2.87 for Henry Hub, a spread of about $18.70, up from about $8.40 in 2025. On 28 October TTF briefly touched €100/MWh, about three times its pre-war level (Reuters).
- Add it up and the EU needs to replace 4–5 Bcf/d: about 3.5 from Russia and up to 1.2 that Qatar used to send. With 17.7 Bcf/d of US capacity under construction and Qatar's expansion stuck behind Hormuz, US plants are where that gas will come from.
- In August 2025 the EU said it intends to buy $750bn of US energy through 2028, and European buyers keep signing with US exporters: Eni and SEFE took 20-year CP2 volumes in 2025, and EnBW signed with Venture Global this June.
That's an opportunity for US exporters, but not automatically for US producers. US plants are already full, so the gap between European and US prices goes to whoever owns plant capacity or cargoes. That's why EQT buys LNG at the plant and is now leasing its own ships.
Domestic: power and data centers
Power is the biggest single use of US gas and the main source of growth at home, but nationally it's growing slowly. EIA has power burn rising from 35.8 Bcf/d in 2025 to just 37.1 in 2027, because solar and wind take most of the new load. For EQT, PJM matters more than the national number.
| Electric power sector, EIA October outlook | 2025 | 2026 | 2027 |
|---|---|---|---|
| Gas-fired generation (billion kWh) | 1,702 | 1,753 | 1,748 |
| Coal generation (billion kWh) | 733 | 691 | 666 |
| Utility-scale solar generation (billion kWh) | 294 | 355 | 420 |
| PJM gas-fired generation (billion kWh) | 391 | 405 | 420 |
| ERCOT gas-fired generation (billion kWh) | 205 | 208 | 212 |
| Gas capacity, year-end (GW) | 495 | 500 | 509 |
| Coal capacity, year-end (GW) | 167 | 162 | 154 |
- The demand is real. PJM set a record 162.6 GW of load on 2 July, in what EIA calls the hottest summer on record.
- Data centers are the big unknown. Lawrence Berkeley National Laboratory expects them to use 649 TWh by 2030, almost 12% of US electricity, within a range of 521–843 TWh; its previous report put 2023 use at 176 TWh. If gas covered 40% of that growth, it would add about 3.5 Bcf/d of burn.
- A lot of that load is heading to PJM. PJM's 2026 forecast adds 38.8 GW of large loads, mostly data centers, to summer peak by 2030, and EIA has PJM's gas-fired generation up 7% over two years against 4% in Texas. That's the growth market EQT can reach without new pipe.
- Texas has slowed. After the governor paused new data-center development in August, EIA cut its 2027 Texas load growth forecast from 14% to 6%. In September he also told the state's environmental regulator to stop issuing data-center permits until ERCOT finishes an audit.
- Coal retirements help. Utilities plan to retire 31.4 GW of coal over 2026–2030, 17% of the fleet.
- Most new gas plants are still on paper. EIA's September inventory lists 67 GW planned for 2026–2030, but only 12.4 GW is built or under construction, and just 7.2 GW of the total is in PJM.
- Gas burn hasn't followed data centers yet. Virginia's power plants burned 3% less gas in 2025 than in 2020, right through the Northern Virginia build-out, while Pennsylvania's burned 21% more and Ohio's 51% more (2025 data are preliminary).
We'd count the 12.4 GW being built and discount the rest. At a 60% capacity factor those plants burn about 1.2 Bcf/d. If all 67 GW got built they'd burn up to ~6.3 Bcf/d, or ~4.9 Bcf/d with peaking turbines running 15% of the time, before netting out the older plants they'd replace.
Domestic: industry and buildings
Industry and buildings burn about 47 Bcf/d, half of US consumption, but add little growth. EIA has industrial use edging up from 23.6 Bcf/d in 2025 to 24.5 in 2027, while homes and businesses slip from 23.2 to 22.4.
- In 2025 homes and businesses used 2.1 Bcf/d more because of the cold weather, so part of the drop in 2026–27 is a return to normal. EIA assumes this winter's heating demand will be about 1% below the five-winter average.
- Industry grows slowly and steadily. EIA's long-range outlook has industrial gas use 11–35% higher by 2050 across its cases, led by bulk chemicals.
- Buildings keep using less. In EIA's long-range baseline, homes fall to about 12.0 Bcf/d by 2035 and businesses to about 8.9.
- Field and pipeline fuel grows with output, from 9.1 to 9.6 Bcf/d by 2027.
- For an Appalachian producer these sectors matter most in winter, when Northeast heating demand tightens the local market. That's why EQT's realized differential went from +$0.05/Mcf in the first quarter of 2026 to −$0.67 in the second and −$0.64 in the third.
Supply: who meets the demand
Nearly all US production growth is coming from outside Appalachia. EIA has US output rising from 118.4 Bcf/d in 2025 to 128.0 in 2027.
EIA Short-Term Energy Outlook, October 2026
Appalachia's share of Lower 48 output slips from 31.7% to 30.1% over those two year and the reason is pipe. Of the ~6.3 Bcf/d of pipeline capacity finished in 2025, EIA says 85% runs into the South Central US, and none of the projects it names links Appalachia to the Gulf Coast export plants. Appalachia has about 3.5 Bcf/d of approved additions coming, led by Transco's Southeast Supply Enhancement (1.6 Bcf/d, 2027) and MVP Southgate (0.55 Bcf/d, mid-2028), while MVP Boost (0.6 Bcf/d) still waits on FERC. Further out, EQT has opened bidding on POWER, a new 42-inch line from its Pennsylvania wells to Ohio's Clarington hub, and Kinder Morgan has committed to its Southeast Connector, up to 2.6 Bcf/d of Marcellus and Utica gas to the Southeast from late 2030.
What it means for an Appalachian producer
Put together, Appalachia grows about 1.4% a year, so a producer there wins on cost and on access to pipe more than on drilling inventory. Industry experts put it simply in a September channel check: wellhead economics don't matter if the gas can't get out.
An Appalachian producer can reach LNG only through contracts and firm capacity to the Gulf. It can reach PJM power directly, and that's where gas-fired generation is growing fastest.
Scale and footprint
After the deal EQT is the biggest producer in the group by ~1.5 Bcfe/d and supplies about a fifth of Appalachia's gas. All of it comes from one basin.
| 2026 guidance (Bcfe/d) | LTM output (Bcfe) | Gas share of volume | Where it produces (net acres) | Net gas as share of Appalachian supply | |
|---|---|---|---|---|---|
| EQT + Range | 8.86–9.11 | 3,321 | 88% | ~2.85m in PA, WV, OH | 21.7% |
| EQT alone | 6.51–6.71 | 2,496 | 94% | 2.07m: PA 1.28m, WV 0.62m, OH 0.17m | 17.6% |
| Range alone | 2.35–2.40 | 826 | 69% | 0.78m, 97.5% in PA | 4.1% |
| Expand | 7.40–7.60 | 2,706 | 92% | Haynesville 745k; NE Appalachia 704k; SW Appalachia 592k | 10.1% |
| Antero | 4.15–4.20 | 1,362 | 66% | ~858k, mostly WV | 7.4% |
| CNX | 1.66–1.70 | 617 | 91% | 881k PA, WV, OH shale; Virginia coalbed methane | 4.1% |
| Comstock | 1.25–1.40 | 434 | ~100% | ~850k in TX and LA | None |
| Gulfport | 1.03–1.06 | 381 | 90% | 223k Ohio; 44k Oklahoma | ~2% |
LTM = twelve months to 30 Jun 2026. Appalachian supply is EIA's 1H26 average of 37.05 Bcf/d of marketed production (STEO Table 5a, Oct 2026). Company volumes are net of royalties and EIA's are gross, so every share here is understated. Antero's figures include HG Energy, which closed on 3 February 2026, for only five months of the LTM.
- Expand is the only peer in two basins, ~57% Appalachian by output.
- The deal takes back the volume lead Expand won by merging with Southwestern in October 2024.
Unit economics
Before hedges, the combined company earned $2.35 of cash margin per Mcfe over the last twelve months. That's second in the group, 3c behind Comstock and 16c below EQT alone, because Range pays more to move its gas.
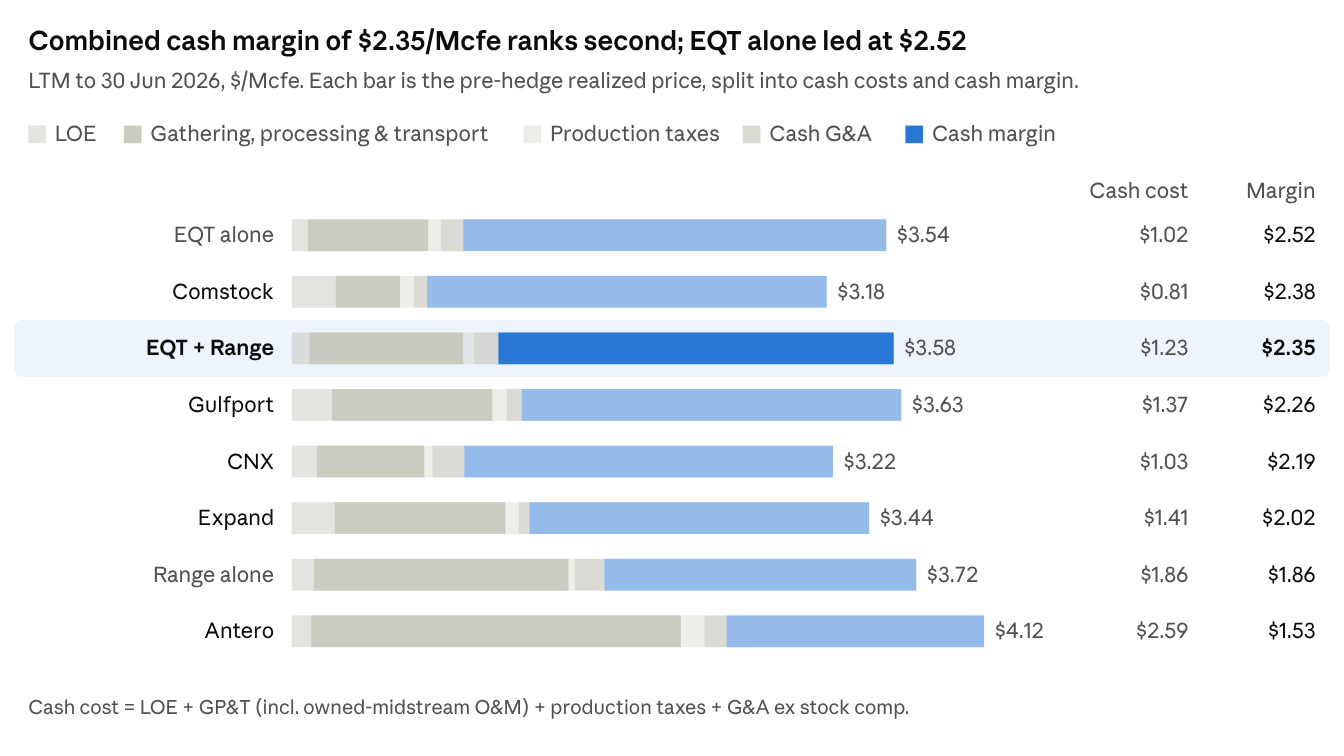
Computed from FY2025 10-Ks, 2Q26 10-Qs and earnings releases · LTM = FY2025 + 1H26 − 1H25
On capital spending it's mid-pack, at $1.04 per Mcfe for 2026, level with Expand. Range ($0.78), Antero ($0.79) and CNX ($0.93) spend less, and Comstock's deep Western Haynesville wells cost the most at $3.10. EQT's own $1.13 includes growth spending; on upstream maintenance alone it's $0.68.
- Synergies decide whether EQT gets its margin lead back. The $325m base case is worth about $0.10/Mcfe, and if all of it showed up in costs the combined margin would be $2.45, ahead of Comstock.
- Owning pipe hides some transport cost in capital and depreciation. At the rates EQT's pipelines charge its own wells, transport would cost $1.14/Mcfe instead of $0.72.
- Range's liquids lift its price more than its margin. It realizes $0.18/Mcfe more than EQT but pays $0.80 more to get its gas and liquids to market. Antero is the extreme case, with the highest price in the group and the lowest margin.
- We'd discount Comstock's lead. Only 41% of its reserves are developed, and its leverage is 3.0x.
Reserves and inventory
The combined company holds 46.2 Tcfe of proved reserves, more than Expand and Antero together. Each unit is worth less, though: PV-10 per Mcfe falls from EQT's $0.913 to $0.805.
| Year-end 2025 | Proved (Tcfe) | Developed | Gas share | Reserve life (yrs) | PV-10 ($bn) | PV-10 per Mcfe | Stated inventory |
|---|---|---|---|---|---|---|---|
| EQT + Range | 46.19 | 72% | 83% | 14.4 | 37.16 | $0.805 | >30 years (deal release) |
| EQT alone | 28.05 | 73% | 94% | 11.8 | 25.59 | $0.913 | ~4,000 gross locations |
| Range alone | 18.14 | 71% | 65% | 22.2 | 11.57 | $0.638 | 27 million lateral feet |
| Expand | 25.88 | 72% | 87% | 9.9 | 19.37 | $0.749 | ~5,000 gross locations |
| Antero | 19.15 | 76% | 62% | 15.2 | 9.68 | $0.505 | 1,279 gross locations |
| CNX | 9.66 | 72% | 90% | 15.4 | 6.83 | $0.707 | Not disclosed |
| Comstock | 7.01 | 41% | 100% | 15.6 | 4.46 | $0.637 | 5,191 gross "identified" |
| Gulfport | 4.25 | 57% | 85% | 11.2 | 3.62 | $0.852 | >700 gross locations |
Reserve life is proved reserves over 2025 output. All seven reports use the same SEC price (Henry Hub ~$3.39/MMBtu), so PV-10 compares across the group. Inventory counts don't, because each company defines them its own way. Antero's figures exclude the ~385,000 net acres it bought from HG Energy in February 2026.
- Reserve life of 14.4 years ranks fourth of six. On PV-10 per Mcfe the combined company slips to second behind Gulfport, because Range's reserves cost more to produce: production costs take 50% of Range's future revenue against 27% for EQT.
- We don't put much weight on the inventory claims. EQT's ~4,000 locations include probable and possible reserves, and the deal's ">30 years" is the companies' own figure.
Route to market
Contracted demand is EQT's other edge over its Appalachian peers. It owns about 2,000 miles of gathering and 1,250 miles of interstate pipe, including MVP, and holds 4.3 Bcf/d of firm capacity out of the basin. At the end of 2025 about 49% of its sales reached markets outside Appalachia.
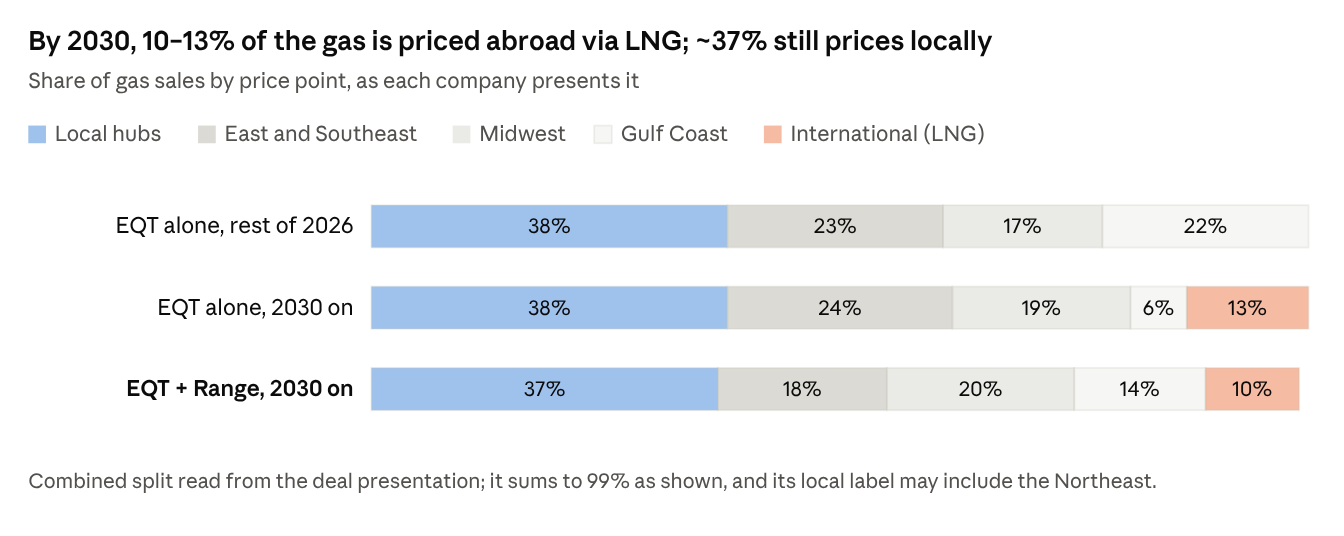
EQT 2Q26 presentation (regional price-point exposure); EQT and Range transaction presentation, 26 Oct 2026
When the contracted LNG plants start up, some of that Gulf exposure becomes international. The local share stays around 37–38%.
Contracted demand by company, as disclosed: